L18 Lab — Beam Steering#
Beam Steering
Two runs put the PHASER’s peak at 30°: move the source, or apply a steer angle.
L18 Lab · Antennas, Phased Arrays, and Radar Systems · Dr. Neil Rogers
Printing
To print the slides, switch to present mode and print: one slide a sheet, with room for notes. Print from read mode for the whole lesson.
Learning Objectives
- I can implement beam steering on the ADALM-PHASER and verify the steered pattern against theory.
From Prediction to Measurement
Part 1, before today: the phase table, the beamwidths, and the error budget.
Part 2, today: two runs put the peak at 0°, 30°, and 45°.
Part 3, after the lab: reconcile each measurement with its prediction.
In Lesson 18 we derived the steering law and used it to fill in a table of element phases for the PHASER’s eight-element array. The L18 Lab packet starts from that table: Part 1, the pre-lab you completed before class, redoes it at your HB100’s frequency, predicts the beamwidths, and sizes the error budget. Today you place the source at measured angles on a protractor arc, and also commands the peak to the same angles from the GUI, and records where the trace peaks, how wide it is, and what the GUI writes into Phase Control. Part 3, on your own before Lesson 19, reconciles those numbers with the predictions.
Part 1: The Steering Prediction
\(N = 8\), \(d = 14\ \text{mm}\), and \(d/\lambda = 0.491\) at 10.525 GHz.
\(\theta_0\) |
\(\sin\theta_0\) |
\(\Delta\phi\) |
|---|---|---|
0° |
0.000 |
0.0° |
15° |
0.259 |
45.8° |
30° |
0.500 |
88.4° |
45° |
0.707 |
125.0° |
The array is fixed: \(N = 8\) elements, E1 to E8, on a \(d = 14\ \text{mm}\) pitch. The source is an HB100 Doppler module at a nominal 10.525 GHz, so \(\lambda = 28.5\ \text{mm}\) and \(d/\lambda = 0.491\), with \(c = 3.00\times 10^8\ \text{m/s}\). Steering to \(\theta_0\) takes a progressive phase of
Lesson 18 worked the same table at the workshop’s 10.3 GHz, where \(kd = 173.2^\circ\) and the 30° step is 86.6°. At 10.525 GHz the step is 88.4°, and Part 1 of the packet redoes the table at the frequency your kit reported in Lesson 17, because every phase in the lab depends on it.
Wrapped Element Phases
Element |
E1 |
E2 |
E3 |
E4 |
|---|---|---|---|---|
Wrapped (°) |
0.0 |
88.4 |
176.8 |
265.2 |
Element |
E5 |
E6 |
E7 |
E8 |
Wrapped (°) |
353.6 |
82.0 |
170.5 |
258.9 |
The 30° ramp; E6 to E8 wrap: 442.0° becomes 82.0°.
The phase shifters produce a value between 0° and 360°, so element E\((n+1)\), which is element \(n\) in Lesson 18’s numbering, gets \(n\Delta\phi\) wrapped modulo 360°. Wrapping changes nothing physically at one frequency, because a phase shift of 360° is no phase shift at all. For \(\theta_0 = 30^\circ\) the eight values are these, and E6 through E8 are the ones that have wrapped:
Element |
E1 |
E2 |
E3 |
E4 |
E5 |
E6 |
E7 |
E8 |
|---|---|---|---|---|---|---|---|---|
Unwrapped ramp |
0.0° |
88.4° |
176.8° |
265.2° |
353.6° |
442.0° |
530.5° |
618.9° |
Wrapped |
0.0° |
88.4° |
176.8° |
265.2° |
353.6° |
82.0° |
170.5° |
258.9° |
Each entry is a multiple of the unrounded step, 88.41°.
The Beam-Sweep Trace
The sweep steps the beam past a fixed source and plots power against steered angle.
The array factor depends on \(\sin\theta - \sin\theta_0\): the trace peaks at the source.
It records the array factor, scaled by the element pattern at the source.
The x-axis of the PHASER’s Rectangular plot is the angle the sweep steers to, not a measured arrival angle. With Lab Preset 1 loaded, the instrument steps the element-to-element phase one phase-shifter LSB, 2.8125°, at a time, and plots each step at the angle that phase steers to; the steps past endfire collect at ±90°, which is why the edges of the trace look crowded.
The trace is a picture of the pattern because of Lesson 18’s “The Steered Pattern”: the array factor depends only on \(\sin\theta - \sin\theta_0\), and its magnitude is even, so power received from a source at \(\theta_{\text{src}}\) as the beam steps across \(\theta_0\) traces the same curve as the pattern of a beam steered at the source. It peaks where the steered angle equals the source angle.
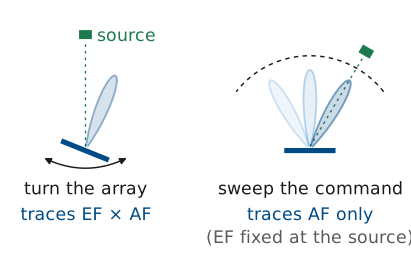
Rotating the array in front of a fixed source would record a different quantity. Turning the array moves the source across the element pattern as well, so the rotation records the element pattern times the array factor (Lesson 16). The sweep holds the element pattern fixed at the source’s direction, so it records the array factor alone, scaled by the element pattern’s value there. That scale factor is what a peak-level comparison between two source positions measures. Every point of the sweep also uses a different set of element phases, so the beamformer’s own errors, phase quantization and gain imbalance, shape the trace.
The Sweep, Step by Step
This is the sweep the PHASER runs, slowed down. Each step adds one phase-shifter LSB, 2.8125°, to the element-to-element phase \(\Delta\phi_s\) and writes the ramp \(+n\ \Delta\phi_s\) to the eight channels. The left panel shows the beam that ramp makes and, in the inset, the eight element signals from the HB100 added tip to tail: each one turned \(kd\sin\theta_{\text{src}} - \Delta\phi_s\) from the last. The instrument plots the power of that sum at the angle the ramp steers to, \(\sin\theta_0 = \Delta\phi_s/kd\), which is the right panel. Away from the source the chain curls up and the point lands in a sidelobe or on the noise floor; as the beam reaches the source the chain straightens and the trace climbs to its peak, at the source’s angle. Move the source and the peak follows it, lower by the element pattern at its new angle; press step to walk the sweep one LSB at a time.
Two Ways to Steer the Peak
Physical run: Phase Control at zero; the source moves to 30°.
Commanded run: the source stays at boresight; Apply 30.
Both peak near 30°, equally wide; only the physical run loses peak level.
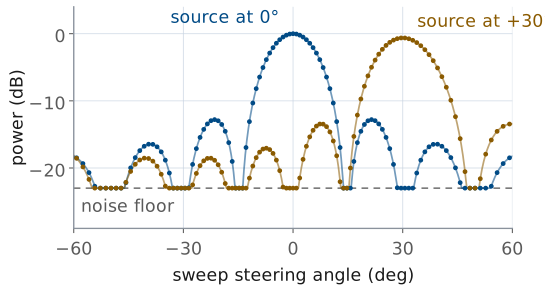
The bench puts the peak at the same angles two ways. In the physical run, Phase Control holds zero, the sweep’s own ramp is the only steering, and the trace peaks at the source’s angle on the arc. In the commanded run, the source stays at boresight and Apply in the Beam Steering section loads per-element offsets that shift the trace: Apply 30 puts a boresight source’s peak at +30°.
The two traces have the same width, because both shift the same function of \(\sin\theta - \sin\theta_0\) to the same place. Their peak levels differ. In the physical run the source sits 30° off each element’s own boresight, and the element pattern lowers the whole trace by its roll-off at 30°. In the commanded run the source never leaves the elements’ boresight, so the peak level matches the 0° trace. That difference is the measurement of scan loss (Lesson 18, “Scan Loss”).
The Sign in Phase Control
Element |
E1 |
E2 |
E3 |
E4 |
|---|---|---|---|---|
Phase Control |
0 |
−88 |
−177 |
−265 |
Element |
E5 |
E6 |
E7 |
E8 |
Phase Control |
−354 |
−442 |
−531 |
−619 |
Apply 30 writes \(-n\Delta\phi\), whole degrees, unwrapped.
The sweep adds \(+n\Delta\phi_s\); the sum vanishes at +30°.
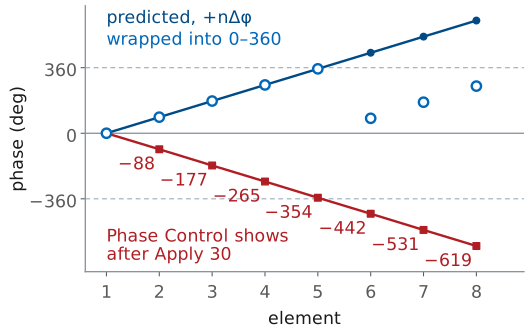
When you type 30 into Steer Angle (deg) and press Apply, the GUI computes \(\Delta\phi\) from the Signal Freq on screen and writes \(-n\Delta\phi\) into the Phase Control boxes, rounded to whole degrees and not wrapped. At 10.525 GHz the boxes read 0, −88, −177, −265, −354, −442, −531, and −619. The sliders beside the boxes stop at ±180°; read the boxes.
The minus sign is deliberate. During a sweep the backend adds its own ramp, \(+n\Delta\phi_s\), to whatever Phase Control holds, so element \(n\) carries \(n(\Delta\phi_s - \Delta\phi_0)\). A boresight source needs no ramp at all, so the array points at it where \(\Delta\phi_s = \Delta\phi_0\), which is the plotted angle +30°. Apply is therefore the offset that makes a boresight source look like a source at \(+\theta_0\) on the sweep plot. On their own, with no sweep ramp added, the offsets would point the beam to −30°. To compare the read-back with the wrapped ramp, reduce it modulo 360°: E6’s −442° is 278°, which is \(360^\circ - 82.0^\circ\).
The GUI computes \(\Delta\phi\) with \(c = 299792458\ \text{m/s}\), not the \(3.00\times 10^8\ \text{m/s}\) of our prediction, so one element can differ by 1° after rounding: our \(-n(88.41^\circ)\) gives −530 for E7, and the GUI’s \(-n(88.47^\circ)\) gives −531.
Predicted Sweep
The widget below is the prediction tool for today’s lab. Set the frequency to 10.525 GHz, or at the bench to the value Find HB100 reports, and the knob to the source’s angle on the arc, which is where the trace should peak. Then read \(\Delta\phi\), the predicted half-power beamwidth, and the peak drop, and two rows of phases: the beam ramp \(+n\Delta\phi\) wrapped to 0° to 360°, and what Phase Control shows after Apply at the same angle, the falling whole-degree offsets. Two things to notice before the bench: the dots mark the angles the sweep samples, one 2.8125° phase step apart, about 1° near broadside and wider toward endfire; and the beam widens as the peak moves away from broadside while the sidelobe structure stretches with it.
Part 2: Equipment and Setup
The kit, cabled to your laptop as in Lesson 17.
The HB100 at patch-row height, 1 m out; 1.2 m for scan loss.
A protractor arc centered on the array; facing the patches, \(+\theta\) is to your left, toward E8.
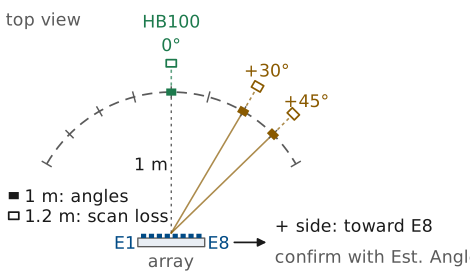
You need the ADALM-PHASER kit on its stand, connected to your laptop by the Ethernet cable as in Lesson 17; the HB100 on a tripod about 1 m from the array face, at the height of the patch row; and a protractor arc of 1 m radius centered under the middle of the array, between E4 and E5.
One meter is Lesson 17’s far-field distance for this array, \(2D^2/\lambda = 0.88\ \text{m}\) with \(D = Nd = 112\ \text{mm}\). Center the arc on the array, not on the board’s edge: an arc centered 10 mm off the middle of the array shifts the reference angle by about 0.5°. The arc serves the angle readings. The scan-loss levels need more distance, 1.2 m (4 ft) or more on the same three lines, for the reason given in Run 1.
Lesson 18’s sign convention puts \(+\theta\) on the E8 end of the array, the end the wave reaches first. Looking at the front of the array, the patch face, E1 is at the right end of the row and E8 at the left, as in the L17 Lab, so \(+\theta\) is to your left as you face the patches. In the figure, which looks down on the bench from above, that puts E8 on the right. Confirm the sign on your kit before you record anything: with the source on the \(+\) side, Angle reads positive.
Bring Up the Kit
Browse to your kit’s address from Lesson 17 (kit 03:
http://192.168.7.13:8080) and wait for the pill to read Connected.Place the powered HB100 1 m out at 0° on the arc, facing the array.
Press Find HB100 and record the Signal Freq it reports in the packet.
Press Calibrate and wait for it to finish.
Open the Lab Presets section and press 1 Steering Angle.
Set Rx Gain (dB) for an FFT peak of \(-10 \pm 3\) dBFS, as in the L17 Lab.
Turn on Show Peak Angle Marker under Plot Options.
Press Start, and check the FFT tab for one tone near 0 MHz, at least 20 dB above the floor.
Open the Rectangular tab.
This is Lesson 17’s order, for the same reason: Calibrate reads the frequency that Find HB100 stores, and it needs the source at boresight while it runs, or it bakes a steering ramp into the calibration offsets. The pill sits at the bottom right and changes from Checking… to Connected; Start stays grayed out until the backend is ready, and nothing plots until you press it.
The preset loads a uniform taper on E1 to E8, zeros Phase Control, sets 7 phase bits with Use Bits on and Signal BW at 10 MHz, and opens the FFT tab. It leaves Signal Freq at the value Find HB100 stored, and it does not set Rx Gain (dB); the Pi starts at 30 dB, where Lesson 17 measured the receiver compressing. Step 6 sets the L17 Lab’s level reference, not a fixed gain: the gain that reaches −10 dBFS depends on your source and on where on the bench your 1 m really is. A main lobe with a flat top means the receiver has clipped; turn the gain down.
On the FFT tab, one narrow tone stands well above the noise near 0 MHz, within about ±1 MHz. If it is buried, re-aim the HB100 or press Find HB100 again.
Run 1: Move the Source
Press Reset under Phase Control.
With the source at 0°, record Angle and the half-power beamwidth in Table A.
Press Freeze to hold the boresight trace.
Move the HB100 along the arc to +30°, still 1 m out and facing the array, and record the same two.
Move it to +45° and record the same two. If Angle jumps to about −90°, read the main lobe’s angle off the trace and record that.
Move the HB100 straight out to 1.2 m (4 ft) or more on the +45° line and record Peak Gain; repeat on the +30° and 0° lines at the same distance.
Read the half-power beamwidth as the distance between the two angles where the trace falls 3 dB below its own peak. The sweep runs continuously and the button now reads Stop, so leave it running: the trace redraws on its own after you move the source. If Angle reads near −30°, the source is on the negative side of the arc; move it across.
At 45° the GUI’s peak readout can jump to about −90°, because the crowded sweep points at the plot’s edge briefly read higher than the main lobe. The sweep’s last steps take the element-to-element phase past −180°, out to −227.8°, which is the same ramp as +132.2° and points the beam within a few degrees of a 45° source; the GUI plots every one of those steps at −90°, so they read within about half a dB of the main lobe, and noise can lift one above it. The main lobe is the trace’s peak near 45°: read its angle off the trace, and record that.
Scan loss needs distance
Take the scan-loss positions, Step 15, at 1.2 m (4 ft) or more. On my kit at 1.2 m the drop at 30° read −0.7 dB, against −0.6 dB for an ideal element and −0.8 to −0.9 dB for a patch; at 1 m the same drop read only −0.2 to −0.4 dB. One meter clears the far-field boundary, 0.88 m, which is enough for the pattern’s shape, its angles and beamwidths, but only marginal for a level difference of under a dB.
If the room forces you closer, take the levels where you can, record the distance, and expect the drop to come out smaller than theory, a few tenths of a dB at 1 m. Say so in the writeup rather than forcing the numbers to agree. Treat the 45° row as limited by reflections at any distance: the same kit read −1.0 dB there, less than even the ideal −1.5 dB.
Run 2: Apply the Steer Angle
Move the HB100 back to 0° on the arc.
In Beam Steering, leave Taper on Uniform, enter 15 in Steer Angle (deg), and press Apply.
Record Angle, Peak Gain, and the beamwidth in Table B.
Repeat for 30, and copy the eight Phase Control boxes into Table B.
Repeat for 45; if Angle jumps to about −90°, record the main lobe’s angle off the trace, as in Step 14.
Press Reset under Phase Control before you leave the station.
Apply also rewrites Element Gains with the chosen taper, so leave it on Uniform. The offsets stay loaded until you press Reset, and they add to every sweep: with Apply 30 still loaded and the source moved to +30°, the trace would peak at 90°. Step 21 leaves the kit at zero for the next lab.
Expected Numbers
Quantity |
Calculated |
Expect |
|---|---|---|
HPBW at 0°, 30°, 45° |
13.0°, 15.1°, 18.7° |
each ±1° |
Drop, source at 30° |
−0.6 dB |
−0.6 to −0.9 dB at 1.2 m |
Drop, Apply 30 |
0 dB |
0 dB |
First sidelobe |
−12.8 dB |
−11 to −13 dBc |
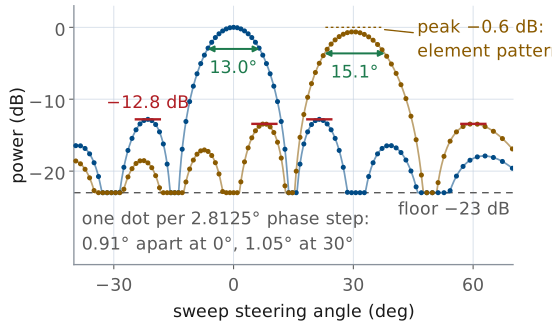
The calculated column comes from the array factor for \(N = 8\) at \(d/\lambda = 0.491\). The \(1/\cos\theta_0\) broadening of Lesson 18 gives \(12.9^\circ/\cos 30^\circ = 14.9^\circ\) from the rule’s broadside width, and the exact array factor gives 13.0°, 15.1°, and 18.7°. A sweep sampled about a degree apart reads each width to about a degree. dBc is dB relative to the main-lobe peak; the sweep’s floor sits about 23 dB below the peak, and the first sidelobes come up out of it at −11 to −13 dBc.
The peak drop is the element pattern’s roll-off, the scan loss of Lesson 18. Its ideal-element bound is
and −1.5 dB at 45°. A patch element rolls off faster, closer to \(\cos^{1.3}\theta\) to \(\cos^{1.5}\theta\) in power, so expect −0.8 to −0.9 dB at 30°; Lesson 21 derives the element pattern. These values hold with the source at 1.2 m or more, where my kit read −0.7 dB at 30°. At 1 m the same kit read only −0.2 to −0.4 dB, so a level taken that close comes out smaller than theory. The 45° drop is limited by reflections from the room: the kit read −1.0 dB there, less than the ideal bound, so treat that row as an estimate. The commanded run keeps the source on the elements’ boresight, so its peak does not drop. The peak-drop rows are hardware measurements: the simulator has no element pattern and reads 0.0 dB in both runs.
No Hardware?
No hardware?
Open the hosted simulator at
livethisdream.github.io/phaser, the
same dashboard with nothing to install. At a station whose hardware has failed,
add ?sim=1 to the station’s URL or turn on Simulator Mode under
Configuration; an orange SIMULATION pill marks simulated data. With a
checkout of the Phaser repository, python phaser_headless.py --sim serves the
same page at http://localhost:8080.
The simulated source is fixed at boresight, so Run 1’s moves have no simulated version. Run 2 works as written, and it is the rehearsal in Part 1 of the packet: Apply 30 gives the trace a source at +30° would, with Angle 29.6° and a 15° beamwidth, and Phase Control shows the same offsets as the hardware. The simulator has no element pattern, so Peak Array Gain does not drop; it does not model Rx Gain (dB); its tone sits at −1 MHz; and Find HB100 and Calibrate run scripted scans.
Part 3: The Peak-Angle Error Budget
Sweep grid, half a step at 30°: 0.53°.
Arc placement and aim: 1.5°.
Room multipath: 1.0°.
Root sum of squares 1.9°: a peak within ±2° passes.
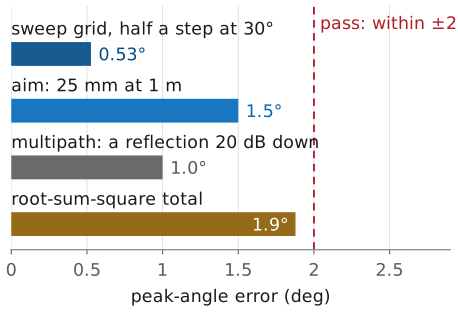
The measured peak angle will not equal the arc angle exactly, and the beamwidths will not equal 13.0° and 15.1° exactly. Three independent effects account for the difference, and Part 1 of the packet sized all three before the measurement.
Sweep grid. With Use Bits on, the sweep steps the element phase one 2.8125° LSB at a time. One step moves \(\sin\theta\) by \(2.8125^\circ/176.8^\circ = 0.0159\), which is 0.91° of angle at broadside and 1.05° at 30°, widening as \(1/\cos\theta\). The trace holds no information between samples, so a peak read off it can be wrong by half a step, 0.53° at 30°.
Arc placement and aim. At 1 m, one degree of arc is 17.5 mm, so a tripod placed by eye to within 25 mm gives a 1.4° error in the reference angle; centering the arc and pointing the module bring the budget figure to 1.5°. This error is in the reference, not in the array.
Multipath. The bench, the walls, and the people nearby return copies of the tone. A reflection 20 dB below the direct path has an amplitude ratio of 0.1, so, depending on its phase, it raises or lowers the level by
a ripple on the main lobe that moves the apparent peak by up to about a degree. Absorber behind the array and a clear arc both reduce it.
Because the three are independent, they combine as a root sum of squares:
A peak within ±2° of the reference meets the standard, and agreement to 0.1° would point to a mistake in the comparison rather than an unusually good measurement.
Why HB100 drift is not in the budget. The GUI sets the receiver from Signal Freq, and the SDR sees only a 3 MHz window. A source that drifts far enough to steer the beam measurably leaves the window and the tone disappears; Find HB100 finds it again. A drift that keeps the tone in view, under 1.5 MHz, moves the beam by less than 0.01°. The arithmetic is worth seeing once as a preview of Lesson 23’s beam squint: phases set for 10.525 GHz and observed at 10.325 GHz point a 30° beam 0.6° farther out, and a 45° beam 1.1° farther.
Your Part 2 Entries
Every box you filled in on this page, in one place. Your entries stay in this browser only, saved as you type. Download my packet writes them into Part 2 of the blank packet and saves the PDF; do Parts 1 and 3 on paper or in the PDF viewer, and upload one PDF to Gradescope. If you have already typed Part 1 into the packet PDF, use Fill my own copy and choose that file instead: your Part 1 is kept, and Part 2 is added to it. Either way the result is locked, so finish any typing in the PDF first. Export entries saves a small backup file you can Import on another laptop or after clearing your browser. The boxes are optional: the blank packet is in the next frame, to fill on paper or in a PDF viewer instead.
Lab Packet
The L18 Lab packet is one submission for the whole lab, turned in complete before Lesson 19. It has three parts:
Part 1, Pre-Lab (individual, before the lab period, because you need it at the bench): the prediction table at your kit’s frequency, what Phase Control will show, the beamwidths and the error budget, and a rehearsal of Run 2 on the hosted simulator.
Part 2, Measurements (your own kit’s data, recorded in class): Tables A and B, from Run 1 and Run 2.
Part 3, Writeup (individual, after the lab): reconcile the measurements with the predictions, and three analysis problems.
Summary: The Steering Law
Symbol / idea |
What it is |
Number to remember |
|---|---|---|
\(\Delta\phi = kd\sin\theta_0\) |
progressive element phase for a beam at \(\theta_0\) |
\(176.8^\circ\sin\theta_0\) at 10.525 GHz |
Wrapped phase |
\(n\Delta\phi\) modulo 360°, what the shifter can produce |
E8 at 30°: 258.9° |
Phase Control after Apply |
\(-n\Delta\phi\), whole degrees, unwrapped |
E8 at 30°: −619 |
Summary: The Trace
Symbol / idea |
What it is |
Number to remember |
|---|---|---|
Beam-sweep trace |
power against steered angle, source fixed |
peaks at the source angle, or at the Apply angle for a boresight source |
Sweep grid |
one 2.8125° phase LSB per step |
0.91° at 0°, 1.05° at 30° |
HPBW |
half-power width, broadens off broadside |
13.0° at 0°, 15.1° at 30° |
Scan loss |
element-pattern roll-off, physical run only |
−0.6 dB bound at 30°; measure at 1.2 m or more |
Peak-angle budget |
grid, aim, multipath, root sum of squares |
1.9°; pass within ±2° |
Looking Ahead
The L19 Lab uses today’s bearing skill: find the live HB100 among numbered boxes.
Lesson 20 derives the trace’s features: nulls, the −12.8 dB sidelobe, and the beamwidth.
Keep Tables A and B; that derivation starts from them.
Lesson 19 and the fox hunt put today’s skill to work while it is fresh: the peak of the sweep is a bearing, and bearings from several stations cross at the source.
Today we compared measured beamwidths and sidelobes with values from Lesson 16’s closed form and Lesson 18’s broadening rule. Lesson 20 takes the closed form
and extracts every feature of the trace you just recorded from it: where the nulls fall, why the first sidelobe sits 12.8 dB down, how the beamwidth follows
and what changes when elements are switched off. Bring today’s traces to that lesson; the derivation is easier to trust with the measurement in front of you.